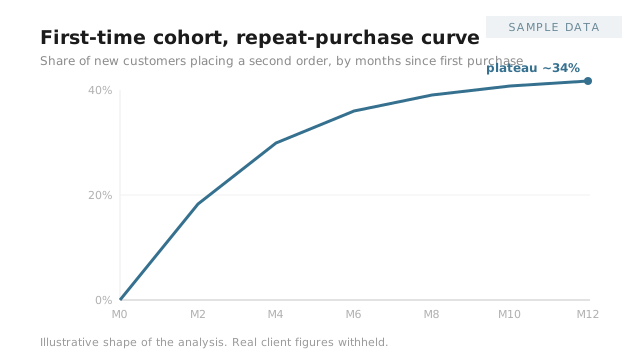
Who comes back, and what brings them.
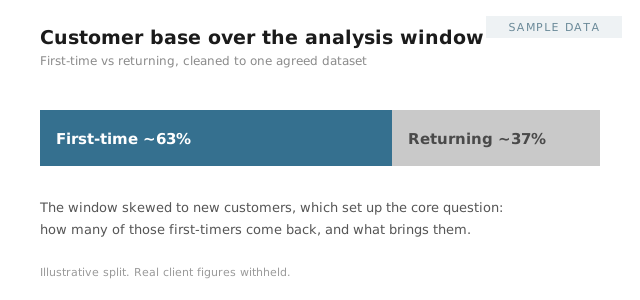
Every customer, 2020–2024
One dataset, both teams trust it
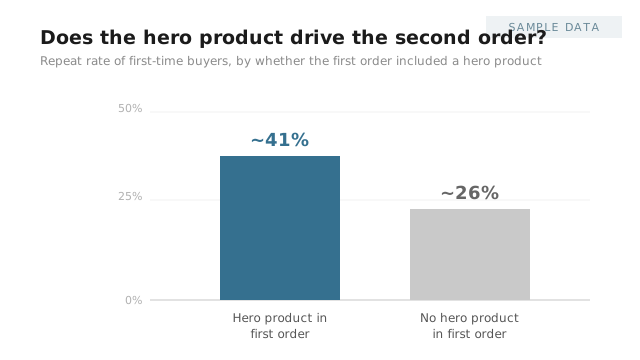
Its role in the second order, measured
The problem.
Summer Fridays wanted to understand repeat-purchase behavior: how many first-time customers came back, and whether specific hero products, the Lip Butter Balm line, were the thing driving that return. But before any answer could be trusted, both sides needed to be sure they were looking at the same numbers. The data had to be cleaned and reconciled first.
The approach.
I built one clean dataset spanning March 2020 to January 2024: total customers, first-time versus returning, and the share of first-timers who came back by the end of the window. Then I drilled into the target products, how many new customers had a hero product in their first order, how many of those returned, and what they bought on the second trip (hero units versus everything else). One agreed-upon dataset, one method, so the review started from facts instead of a reconciliation fight.
The outcome.
The team got a clean read on repeat-purchase behavior and the hero product's role in driving it, the foundation for retention and merchandising decisions, built on numbers both sides trusted. The kind of question that usually dies in a spreadsheet disagreement, settled in one pass.
From the work.
If every analysis stalls on a reconciliation fight, I'll build the one clean dataset your teams agree on, then answer the actual question. One slot open for Q3 2026.